All the best plans can go astray sometimes, and my pledge to post a new social media stats article every month definitely falls into the straying category. In my defense, I haven’t really been lazy; I’ve just been neglectful – which (at least in my mind) is way more justified. It probably may come as a surprise to some of you that I actually have a life outside this blog (which, let’s not forget, I do not get PAID to write) – it may be a sad, lonely, cat-obsessed existence, but it is an existence where I do have to do other shit that actually pays the bills… which with my recent online shopping obsession, car purchase and overseas holidays seem to be piling up.
Moving along, find below the latest statistics update for you after the no less than 10 trillion billion requests I’ve gotten in the past couple of months. Also, after the 34 million complaints about my lazy referencing style in past articles, I’ve tried to be a bit better with this in this article. Basically, if you want the source for a certain statistic, it should be (should be the operative word) the next hyperlink you see after the stat – I’ve only included the reference on the last stat point of each reference. I suspect that probably made no sense whatsoever, but just figure it out. Seriously, I can’t (or won’t?) do everything.
Oh, and one more thing. I don’t make up any of these statistics myself. I get them from all those other, much more reputable sources. So if some of them don’t make sense, or they conflict with each other, or they are utterly ridiculously wrong, it’s not my fault. It’s their fault. So that’s my disclaimer.
General social media and Internet stats
- 40 % of accounts and 8% of messages on social media sites are spam
- 91% of online adults use social media regularly
- About 1 in 3 bloggers are moms/mums (had to cater to both our American and British/AU audience there J) (source: Hubspot)
- There are more devices connected to the Internet than there are people on Earth (source: AllTwitter)
- 24% of people have missed witnessing important moments because they are too busy trying to write about them on social networks
- 83% of people believe platforms like Twitter and Facebook help them make new friends
- 25% of people believe social networks have boosted their confidence
- 40% of people spend more time socializing online than they do face-to-face (source: AllTwitter)
- Every minute of the day:
- 100,000 tweets are sent;
- 684,478 pieces of content are shared on Facebook;
- 2 million search queries are made on Google;
- 48 hours of video are uploaded to YouTube;
- 47,000 apps are downloaded from the App Store;
- 3,600 photos are shared on Instagram;
- 571 websites are created.
- Internet users spend 22.5% of their online time on social networking
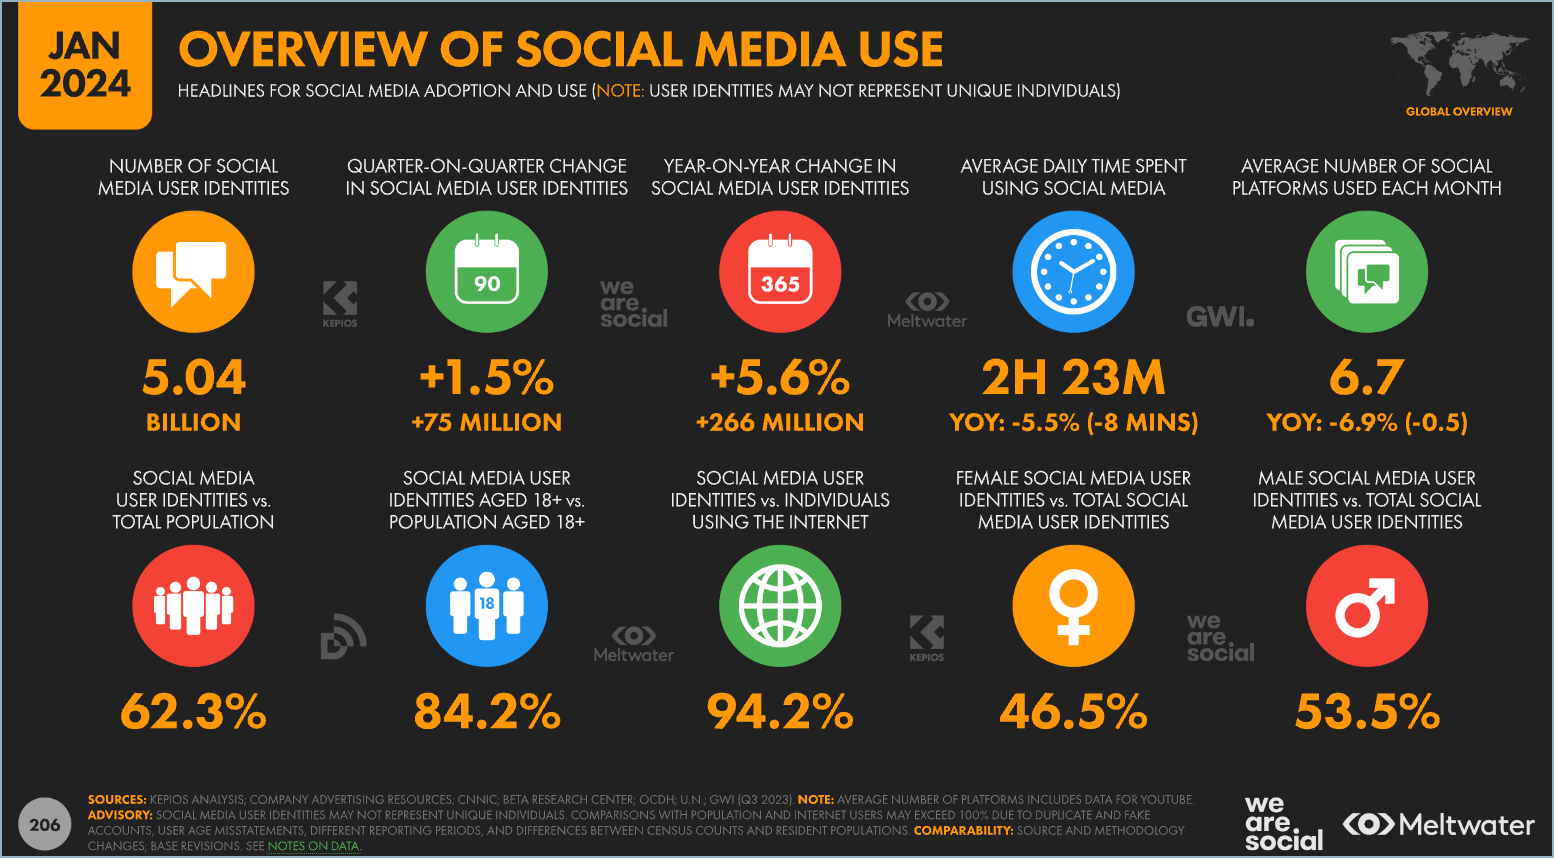
- There are more than 4.95 billion people online (doubled since 2015)
- 70% of adult social networkers shop online
- 53% of active adult social networkers follow a brand
- 80% of active internet users visit social networks and blogs (Source: AllTwitter)
- Almost 8 new people come onto the internet every second
- 79% of online shoppers spend 50% of their online shopping time researching products
- the average budget spent on blogs and social media has almost tripled in 3 years
- 57% of marketers acquired customers via blogging
- 44% acquired customers via Twitter
- 61% of global internet users research products online
- US Internet users spend three times longer on social media and blogs than on email
- 65% of Pinterest’s traffic is from the US
- there are 152 million blogs on the internet
- companies that have blogs have 55% more website visitors
- 35% of consumer comments on Facebook Pages are compliments
- 93% of US adult Internet users are on Facebook
- 9/10 mobile searches lead to action – over half lead to purchase (source: Hubspot)
- global e-commerce sales were expected to hit $5.5 trillion in 2022;
- in the United States, consumer spending is a critical component of economic activity, making up about 70% of the economy.
In 2023, YouTube and Facebook remained the most widely used platforms among U.S. adults, with YouTube being used by roughly 83% and Facebook by 68% of adults. Instagram also held a strong presence, with about 47% of adults using the platform. TikTok, in particular, has seen notable growth, with its user base increasing to 33% of U.S. adults, up from 21% in 2021.
Demographically, social media usage shows stark differences by age, with younger adults more likely to use platforms like Instagram, Snapchat, and TikTok compared to their older counterparts.
For example, 78% of 18- to 29-year-olds report using Instagram, significantly higher than the 15% usage rate among those 65 and older.
Similarly, TikTok usage is much higher among 18- to 29-year-olds (62%) compared to just 10% among adults 65 and older. Other platforms like X (formerly Twitter), Pinterest, LinkedIn, and Reddit also have significant penetration rates among U.S. internet users, with X having a 42.30% penetration rate, Pinterest at 37.00%, LinkedIn at 29.90%, and Reddit at 29.30%.
Messenger apps also play a critical role in the social media ecosystem, with Facebook Messenger leading as the most popular in the US, having 60.30% of the country’s total internet users, followed by iMessage and Snapchat. The landscape of social media in the US continues to evolve, with platforms rising and falling in popularity. The demographic disparities in usage patterns underscore the tailored appeal of each platform to different segments of the population.
Facebook Statistics
- Each day, Facebook users spend 10.5 billion minutes (almost 20,000 years) online on the social network.
- Australians spend 26 minutes, 27 seconds on Facebook each day, New Zealand 30m31s, Singapore 38m46s, United Kingdom 26m27s, France 21m53s, United States 20m46s, India 20m21s, Brazil 18m19s
- Only 50% of Facebook users have more than 100 friends (source: AllTwitter)
- As of 2024, Facebook has approximately 2.085 billion daily active users (DAUs) globally
- An average of 3.2 billion likes and comments are posted every day
- Facebook posted a 67 percent year-over-year mobile growth rate (543 million monthly active users on mobile).
- The 6:35 per month spent on Facebook is nearly double the time (3:20) spent on Google.
- 58% of users return to the site daily.
- In an analysis of more than 60 Facebook marketing campaigns, 49 percent reported a return on investment of more than five times, while 70 percent had a return on investment greater than three times. (source: AllFacebook)
| Global Market | Unique Audience | Active Reach |
| Brazil | 38,138,000 | 76.7% |
| Italy | 21,270,000 | 70.5% |
| Spain | 15,628,000 | 67.0% |
| France | 28,335,000 | 66.9% |
| United Kingdom | 25,737,000 | 63.9% |
| Germany | 24,508,000 | 54.6% |
| Japan | 14,877,000 | 24.4% |
| Switzerland* | 1,985,000 | 50.3% |
| New Zealand** | 2,672,000 | 79.8% |
| Taiwan** | 11,068,000 | 77.9% |
| United States** | 152,763,000 | 69.6% |
| Australia** | 11,010,000 | 68.4% |
* Online measurement in Switzerland is from Home computers only.
** New Zealand, Taiwan, the U.S., and Australia use Hybrid measurement, which includes sources in addition to home/work computers.
Source: Nielsen
- In any given week, less than 0.5% of Facebook fans engage with the brand they are fans of. (Source: Marketing Science)
- 20% of Facebook users have purchased something because of ads or comments they saw there. (Source: Ipsos)
- We are finding that 50 percent of smartphones are actually connecting to Facebook every hour of every day. (Source: AllFacebook)
- Facebook has 232 million users in Europe, 222 million in North America, and 219 million users Asia. (Source: AllTwitter)
LinkedIn Statistics
- 61% use LinkedIn as their primary professional networking site
- 81% of LinkedIn users belong to at least one group
- 42% of users update their LinkedIn profile information regularly
- 82% are aware there are ads on LinkedIn
- 60% of users have clicked on an ad
- 90% of users find the site to be useful
- 61% do not pay for a premium LinkedIn account (source: Socialtimes)
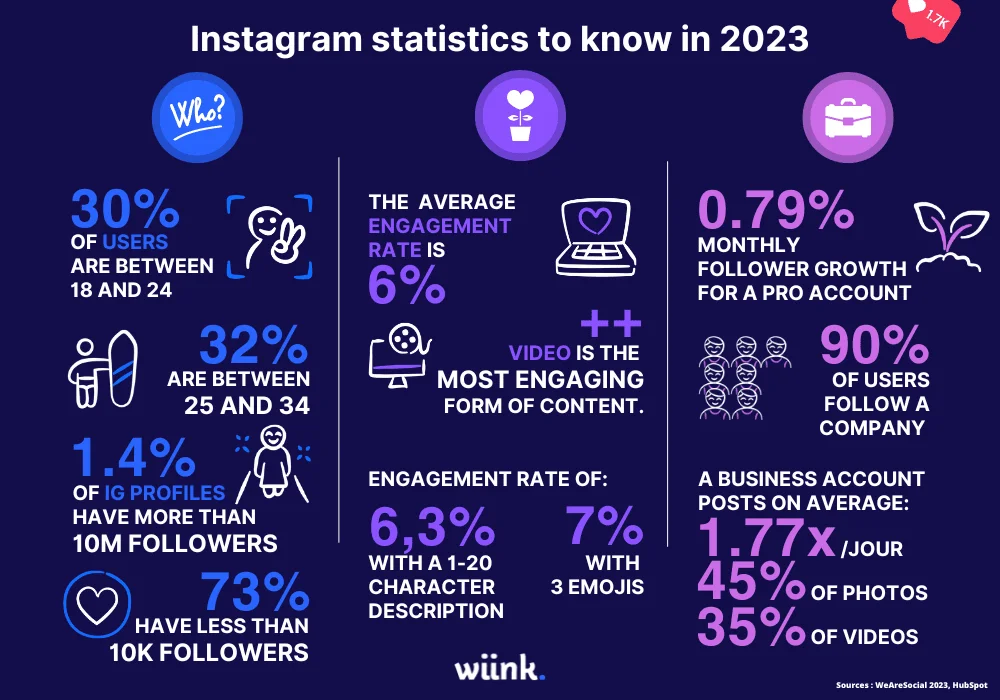
Instagram Statistics
- More than 50 million users over the past 2 years.
- 300 million pictures are uploaded to Facebook a day (via Instagram).
- Instagram gains one new user every second.
- One billion photos have been taken with the app.
- There are 58 photos uploaded every minute.
- 575 likes and 81 comments by Instagram users every second (source: Digital Buzz Blog).
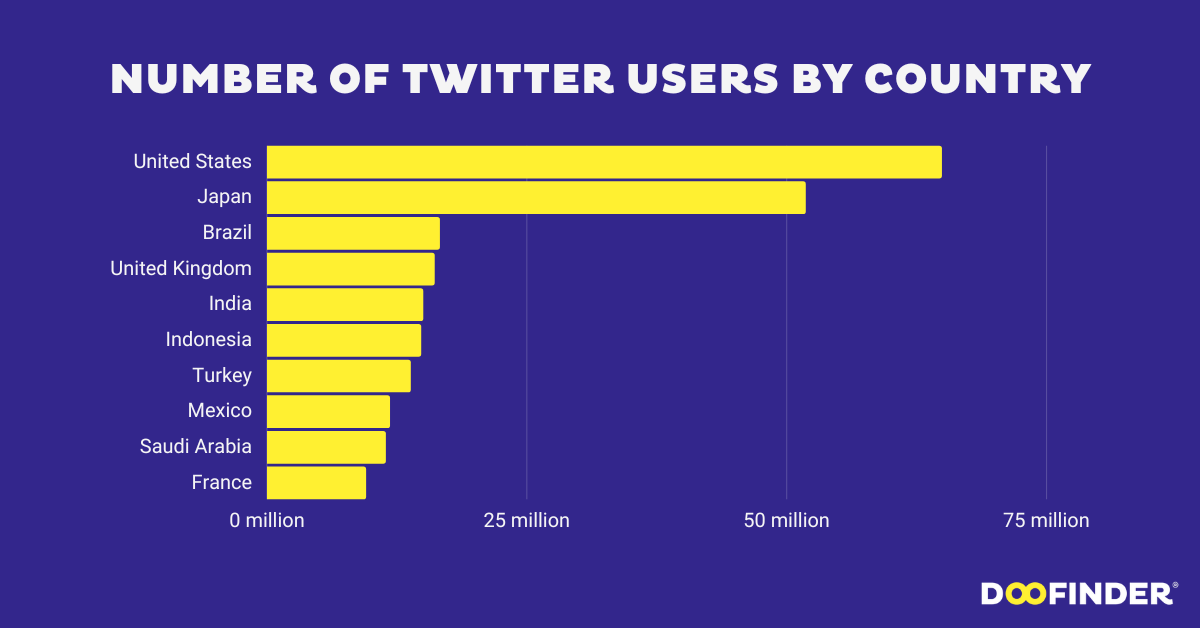
X (Twitter) Statistics
- Twitter has over 500 million registered users but just 140 million active users (compared to Facebook’s 950 million active users and probably over 2 billion registered users).
- The USA, whose 141.8 million accounts represent 27.4 percent of all Twitter users, is good enough to finish well ahead of Brazil, Japan, the UK and Indonesia. (Source: AllTwitter).
- There are over 1.3 million active Twitter users in Arab countries.
- Kuwait leads the way in Twitter penetration in Arab nations at 8%, ahead of Bahrain at 4%, Qatar at 2%, the UAE at 2% and Saudi Arabia at 1%
- Kuwait sent almost 60 million tweets in March (source: AllTwitter).
- 15% of online adults use Twitter.
- 28% of black online internet users use Twitter.
- 14% of Hispanic internet users are active on Twitter.
- 12% of white internet users are active on Twitter.
- The 18-29 demographic is most represented on Twitter, at 29% of the user base, ahead of those aged 30-49 (14%) and 50-64 (9%).
- 14% of online men use Twitter vs 15% of online women (source: AllTwitter).
- Roughly 9% of US adult Internet users are on Twitter.
- The average Twitter user has 27 followers.
- 25% of Twitter accounts have no followers.
- 40% of Twitter accounts have never sent a single tweet.
- Only 18% of Twitter users tweet once or more a day.
- More than half of active Twitter users follow companies, brands or products on social networks.
- 79% of US Twitter users are more like to recommend brands they follow.
- 67% of US Twitter users are more likely to buy from brands they follow.
- 57% of all companies that use social media for business use Twitter (Hubspot).
Mobile/Smartphone statistics
- Smartphone statistics
See what I did here? IT’S NOT EVEN AN IPHONE IMAGE! Turns out other smartphones exist. I have no idea what this is, but it looks a lot like an iPhone, except it’s not one. That’s all I have to say about that.
Mobile now accounts for 10% of internet usage worldwide (this has more than doubled over the last 18months) (The Next Web)
- 1.08 of the world’s 4 billion mobile phones are smartphones.
- Apple and Android represent more than 75% of the smartphone market,
- 7.96% of all web traffic in the U.S. is mobile traffic. That number skyrockets to 14.85% in Africa and 17.84% in Asia — up 192.5% since 2010.
- 29% of mobile users are open to scanning a mobile tag to get coupons.
- 39% of instances where a consumer walks out of a store without buying were influenced by smartphones.
- 91% of mobile internet access is for social activities, versus just 79% on desktops (Source: Hubspot).
- Over 1/3 of Facebook’s users access Facebook Mobile; 50% of Twitter’s users use Twitter Mobile.
- QR code scans increased by 300% in 2011 compared to 2010.
- The average tablet user spends 13.9 hours per week with the device.
- 73% of smartphone owners access social networks through apps at least once per day (Source: Hubspot).
- There was a 103% growth in website traffic from smartphones from 2011-2012.
- US consumers spend almost 1 in every 10 e-commerce dollars using a mobile device (Source: Hubspot).
- There are currently 6 Billion mobile subscribers worldwide.
- This equals 87% of the world’s population.
- China and India account for 30% of this growth.
- There are over 1.2 Billion people accessing the web from their mobiles.
- Over 300,000 apps have been developed in the past 3 years.
- Google earns 2.5 Billion in mobile ad revenue annually (Source Digital Buzz Blog).
Multi-screen Media Usage Statistics
- Multi-screen usage
Just a note: if you have this many screens, seek help.
Watching video on computers has become as common as watching video on television among online consumers
- Mobile video is prominent in Asia-Pacific and Middle East/Africa, where 74% and 72% of online consumers, respectively, watch video on mobile at least once a month (and almost 40% say they do at least once a day) (source: Nielsen).
- 38% of North Americans watch mobile video once a month.
- 90% of people move between devices to accomplish a goal.
- 38% of our daily media interactions are on smartphones.
- On average, we spend 4.4 hours of our leisure time in front of screens each day.
- Our time online is spread between 4 primary media devices: TV (43 min.), PC/laptop (39 min.), tablet (30 min.), smartphone (17 min.).
- 54% of smartphone use is motivated by communication, and 33% by entertainment.
- 60% of smartphone use occurs at home, while 40% occurs out of the home.
- 63% of tablet use is motivated by entertainment, and 32% by communication.
- 80% of searches conducted on a smartphone are spontaneous.
- 59% of smartphone shopping is done at home, while 41% is done out of the home.
- 30% of shopping-related content accessed on a smartphone is driven by search. (Source: Hubspot)
Social media for business statistics
I Google Image searched ‘social media for business’, and this picture made me laugh. there’s nothing inherently social media-ish about it, but it just looks funny. Don’t you agree?
- 27% of small and 34% of medium businesses are using social media for business (+10% Year on Year)
- 25% of SMBs have no strategy, and only 28% of small and 24% of medium businesses measure their ROI of social media activity (source: MarketingMag).
- Social media users who receive excellent customer service from brands spend, on average, 21% more than non-social customers.
- 83% of socially savvy consumers have walked away from a purchase in the past year after a negative customer service experience – compared with 49% of everyone else.
- 80% of businesses use social media sites to monitor/extract information relating to competitors.
- Only 44% of customer questions on Twitter are answered within 24 hours.
- 56% of customer tweets to companies are being ignored
(sources: AllTwitter, AllTwitter and AllTwitter). - 55% of consumers share their purchases socially on Facebook, Twitter, Pinterest and other social sites.
- Facebook is the most popular site to share online purchases (55%), Twitter (22%), Pinterest (14%), Instagram (5%) and LinkedIn (3%).
- 59% of Pinterest users have purchased an item they saw on the site, and 33% of Facebook users have purchased an item they saw on their news feed or a friend’s wall.
- 79% of Pinterest users are more likely to purchase items they’ve seen on Pinterest compared with Facebook users’ purchasing behavior.
- 64% of Facebook users have clicked on a Facebook ad, but only one-fourth of these users actually converted and bought an item.
- When making online purchases, 66% of consumers prefer to purchase from a retailer’s online site, vs its app (Source: AllTwitter).
- There are over 10 million social mentions of the Fortune 100 each month.
- Twitter generates the most amount of chatter.
- 87% of the Fortune 100 now use social media – with twitter the most popular.
- Tweet volumes tripled in the last 12 months.
- 75% of the Fortune 100 are on Facebook.
- Each corporate YouTube Channel averages 2 million views.
- Fortune 100 Companies are creative with multiple accounts per platform / per region.
- 50% of Fortune 100 Companies have a Google+ Account.
- 25% have a Pinterest Account (Source: Digital Buzz Blog).
- Facebook is the number one social marketing tool for brands at 83% (88% target for 2014), followed by Twitter at 53% (target 64% in 2014) (source: AllTwitter).
- On average, companies respond to only 30% of social media fans’ feedback (Source: Factbrowser).
- By 2016, more than half of the dollars spent in US retail will be influenced by the web (Source: Forrester Research).
- 42% of employers say no to any use of social media in the workplace.
- 40% of young workers rate access to social media at work above receiving a higher salary.
- 53% of employers have a formal policy on social media.
- 59% of media companies actively encourage their employees to use social media.
- 71% of energy companies prohibit any use of social media at work.
- Over 50% of workers aged over 50 use social media every day at work (source: AllTwitter).
- 73% of Fortune 500 companies have a Twitter account.
- 66% of Fortune 500 companies have a Facebook page (source: AllTwitter).
- 18 different countries across Asia, including Australia, China, Hong Kong, India, Indonesia, Japan, Malaysia, South Korea and Thailand, discovered that Facebook (88.8 %), Twitter (66.4%) and YouTube (62.4%) were the social platforms of choice amongst all respondents.
- LinkedIn (40%) finished fourth, ahead of blogs (39.2%) and Pinterest (20.8%), with Google+ being used by just 12.8% of Asian corporate marketers. (Source: AllTwitter).
- 94% of corporates use social media, and 85% say it’s given their business more exposure.
- 74% of brand marketers saw an increase in website traffic after investing just 6 hours per week on social media.
- 61% of corporates still rate blogging overall, and 23% of Fortune 500 companies actively maintain a corporate blog.
- 76% of corporate marketers plan to increase their use of YouTube or other video marketing.
- 65% of corporate marketers use social media to gain market intelligence (source: AllTwitter).
- 24% of the top 10,000 websites in the world use some form of official Facebook integration on their homepage (if standard links to Facebook Pages are included, this jumps to 49%).
- 42% of the top 10,000 websites have some form of a Twitter link on their homepage, just 4% use Twitter’s share button and only 10% utilize any official Twitter widgets.
- The Facebook Like button is used on 7% of the top 10,000 homepages.
- LinkedIn is featured on just 0.6% of the top 10k websites (0.3% using the LinkedIn share button) (source: AllTwitter).
- People are 25% more likely to buy a product that they would be proud to own if it has social media buttons next to it.
- People are 25% less likely to buy an embarrassing product if it’s placed anywhere near a social sharing tool.
- 70% of brands ignore complaints on Twitter.
- 83% of people who complained on Twitter loved the response from those companies that did make the effort.
- Only 26% of businesses regularly include a call to action in their tweets (source: AllTwitter).
- 42% of marketers believe Facebook is critical or important to their business (+75% since 2009).
- 62% of marketers say social media became more important to their marketing campaigns in the last six months.
- Social media has a 100% higher lead-to-close rate than outbound marketing.
- 77% of B2C companies have acquired customers from Facebook vs 42% of B2B.
- Retail is the top industry that has acquired customers through Facebook (over 90%).
- 80% of US social network users prefer to connect to brands through Facebook.
- Brands have seen a 46% increase in user engagement with the new Timeline format on Facebook.
- Auto-posting to Facebook decreases likes and comments by 70% (Source: Hubspot).
- Facebook is responsible for 86% of social referrals, Pinterest 11% and Twitter 3%.
- Facebook users generate 2.5 times more page views than Twitter and almost twice as many as Pinterest (FB 7, Pinterest 4.1, Twitter 2.7).
- Conversion rates for Facebook traffic: 2.6%, Pinterest 0.9% and Twitter 1.1%.
- Average order value (AOV): FB $2.50, Pinterest $1.60, Twitter 80c (source: AllTwitter).
- 25% of Twitter users connect with a brand on the platform (over one-third of these do so for discounts and promotions).
- Over 25% of Twitter users would consider contacting a business via the platform.
- Over half of social networking users who share business-related content do so on Twitter (source: AllTwitter).
- 39% of companies do not track their social media responses at all, and 55% ignore all customer feedback on Twitter and Facebook, largely because they have no process in place to respond. (Source: AllTwitter).
- What do people want from brands on social media? ….
- 83% want deals and promotions
- 70% want rewards programs
- 58% want exclusive content
- 55% want feedback on new products (source: AllTwitter)
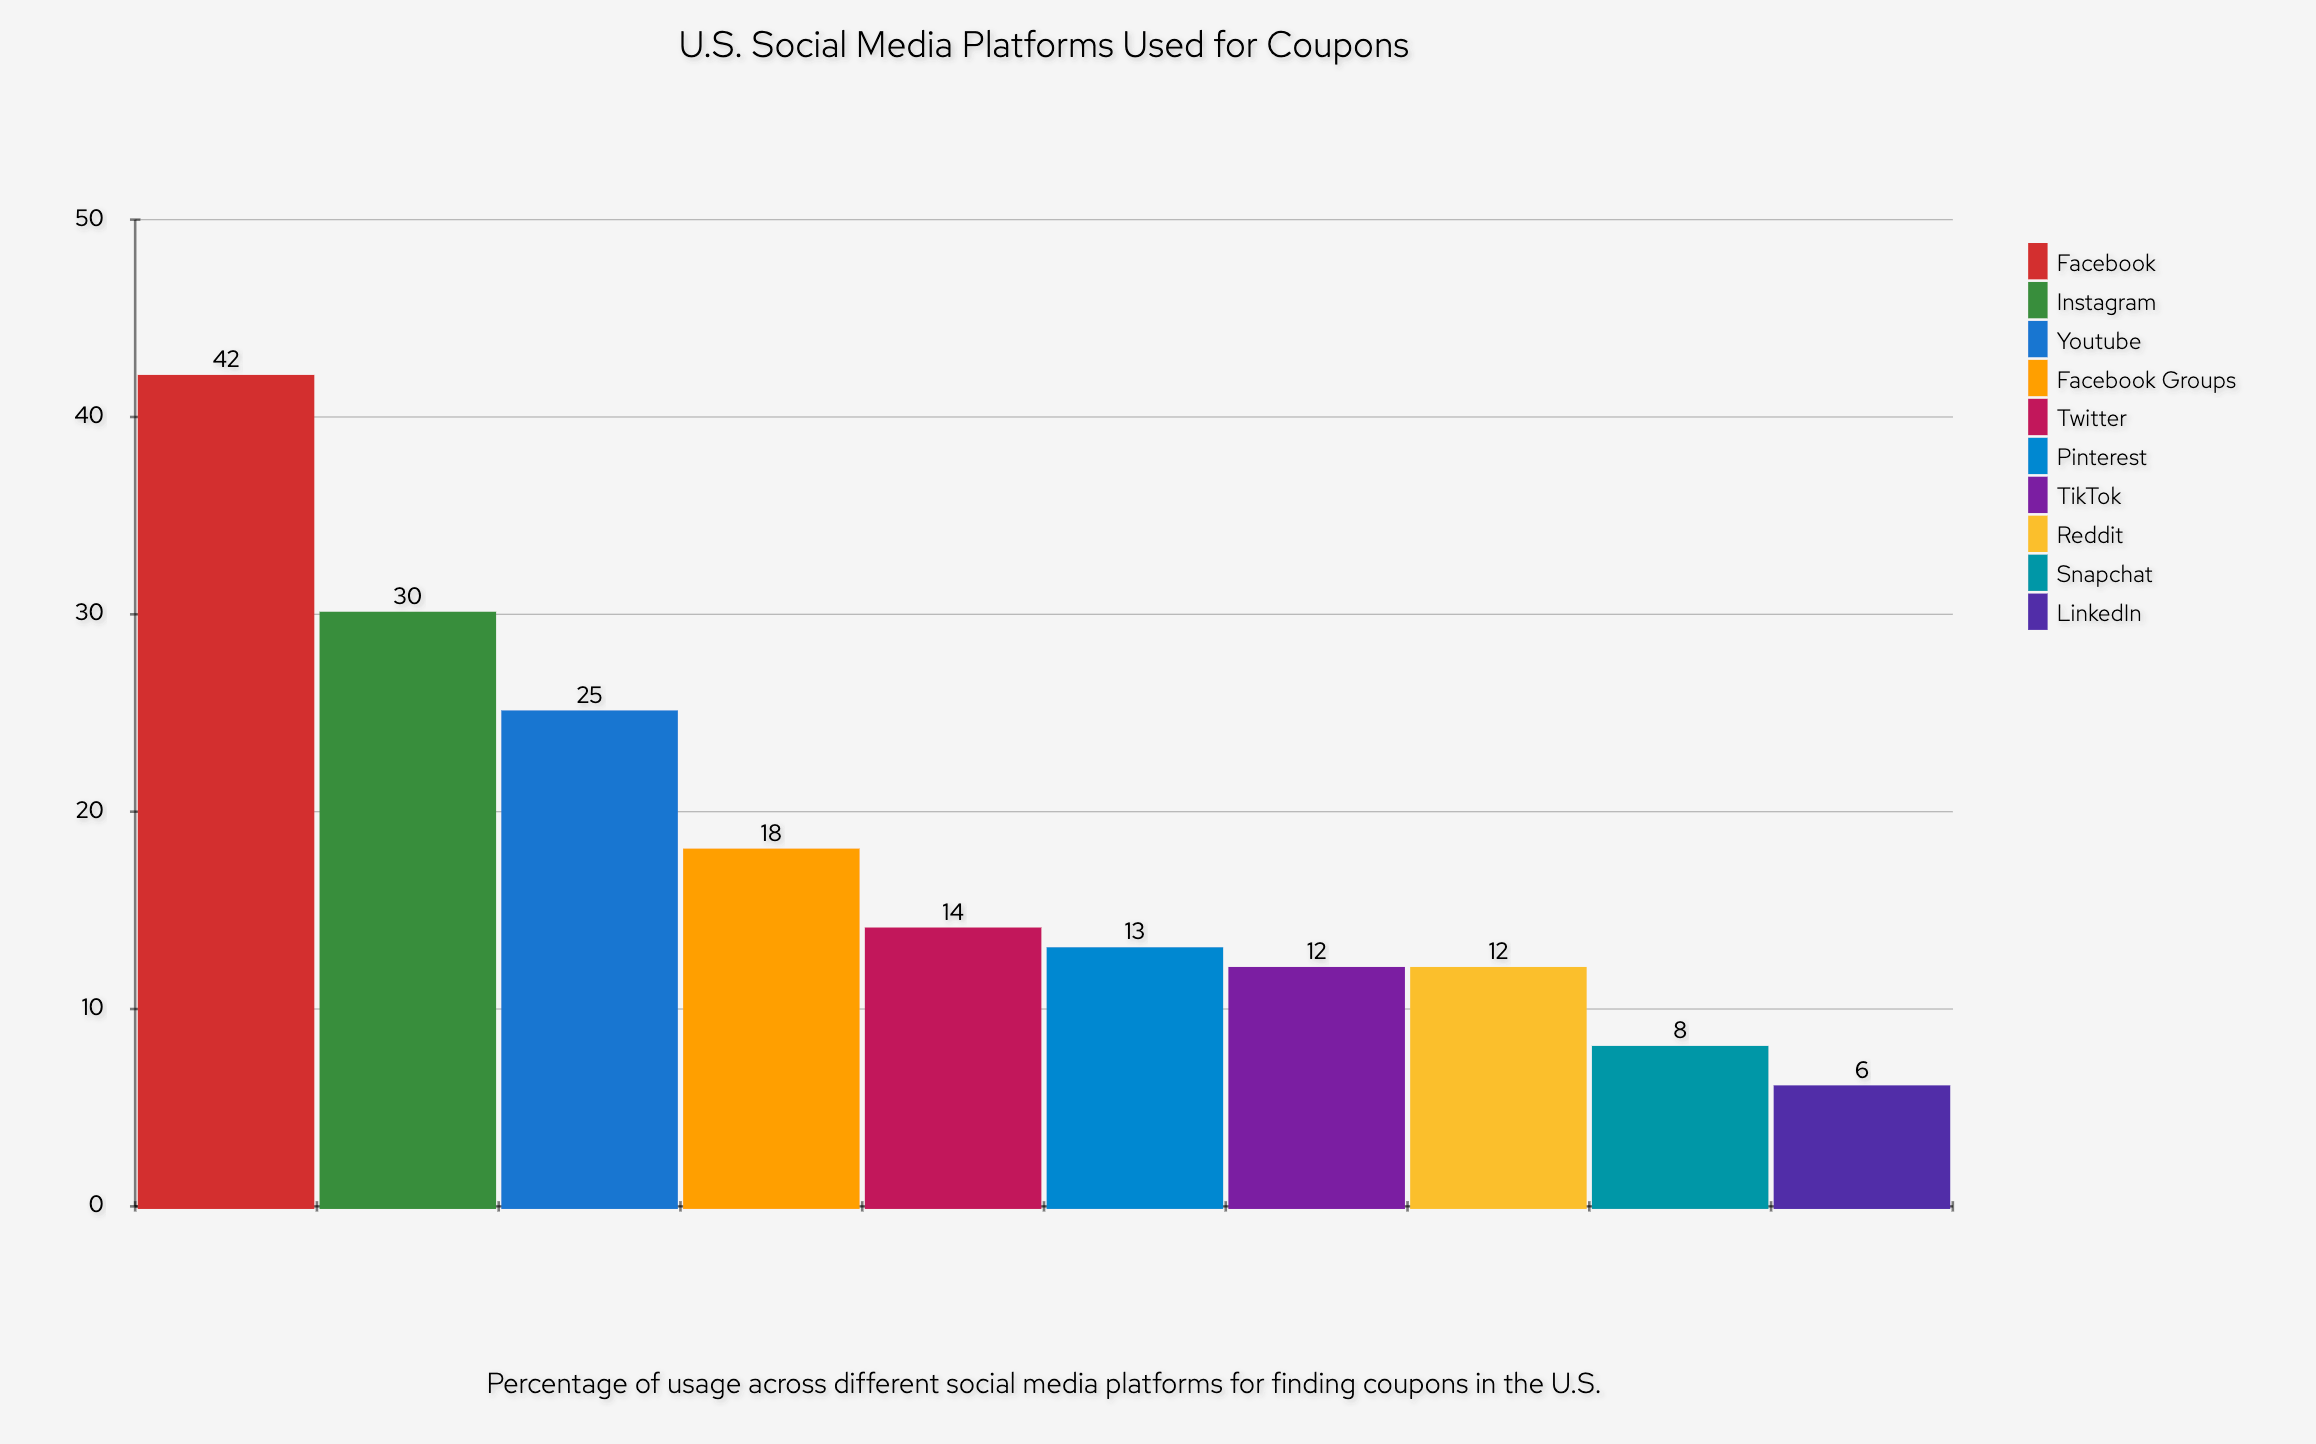
Coupons on social media
67% of customers will like a Facebook page to save 25% or more
- 17% will tweet or retweet a deal to save 25% or more.
- 28% of consumers share deals through social media.
- 12% have looked for deals on social media sites using their smartphones (Source: AllTwitter).
Social media security
- 1 in 4 users location tag their Facebook posts each month.
- More than 20 million US users have their birthdays and years included in their profiles.
- An average user has 229 Facebook friends.
- 16% of Pinterest accounts are connected to Twitter.
- 50% of Facebook users check their security settings every 2-3 months (source: AllTwitter).
Social Gaming
- 58% of Social Gamers are over 40 years old.
- 29% are Married with children.
- 79% have a college degree or better.
- 44% earn over $50,000 per year.
- 8% of people access the games from a mobile phone (source: Digital Buzz Blog).
So there you have it. Over 200 social media and Internet statistics are just for you. You are so totally having a social media statistic orgasm right now.
When will I post another update? Let’s just say I wouldn’t hold your breath. But it WILL happen. It won’t happen overnight. But it seriously will happen. Just not for a while. Got any other social media stats I’ve missed? Share them below. Or don’t. What the f*^% do I care?